The term “hypergrowth” was introduced in a 2008 Harvard Business Review article. In short, the article recognized that certain companies were able to scale their sales at never-before-seen growth rates.
At this time Google had recorded several years of spectacular sales growth, increasing from $1.5 billion in 2003 to $21.8 billion in 2008. Apple, riding the crest of a similar sales curve, saw its sales explode from $6.2 billion in 2003 to nearly $32 billion in 2008.
In 2016 the World Economic Forum, building on the hypergrowth phenomenon, segmented the growth stock universe into three classes. Hypergrowth companies were categorized as having sales growth upwards of 40%, followed by rapid growth companies which exhibited sales growth of 20-39%. The third tier of growth stocks was designated as having normal growth rates of 1-19%.
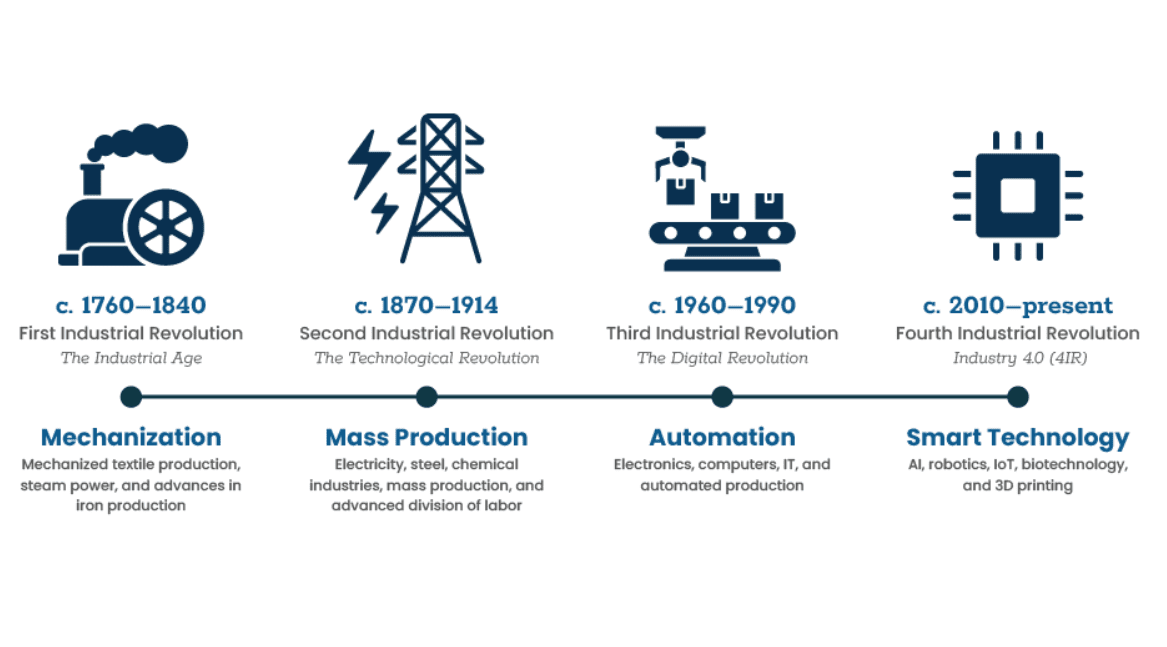
Much of the emergence of hypergrowth companies is related to the so-called Fourth Industrial Revolution, a topic popularized by the World Economic Forum in 2016. The First Industrial Revolution was marked by a transition from hand work to machine production powered by steam and water power. The Second Industrial Revolution centered around railroad and telegraph construction which allowed for faster movement of people and information.
The Third Industrial Revolution, also referred to as the Digital Revolution, started in the late 20th century and revolved around information technology in connection with both personal computers and the internet.
We are now in the Fourth Industrial Revolution marked by rapid technological development. Areas of emphasis in this revolution include advanced development of artificial intelligence, gene editing and robotics. Many companies that have come of age in this era have global reach which has given rise to more hypergrowth companies than ever before.
Golden Eagle Strategies became intrigued by the Hypergrowth Stock concept some years ago and conducted what is believed to be the first study on Hypergrowth Stock returns. We have analyzed approximately 250,000 stock periods from the U.S. listed equity universe from 2010 to 2025. Our study shows that the Hypergrowth Stock class has proved to be the most rewarding among the three classes of growth stocks as seen below.
Hypergrowth Stocks have produced an average annual return of 43% compared to an average annual return of 29% for rapid growth stocks and 17% for normal growth stocks.
At this point, the reader could surmise that Hypergrowth Stocks covered in our study were predominantly tech stocks, which is not the case. We have found that hypergrowth companies exist in nearly every one of the 11 economic sectors defined by S&P Global.
Hypergrowth Stock trends tend to be rotational. Tech stocks predominated in our study in 2020, energy stocks in 2022, health care and financial stocks in 2023 and 2024. In early 2026, many materials stocks including gold and silver mining stocks were prevalent in our list of Hypergrowth Stocks.
Our research shows that most companies cannot sustain four consecutive quarters of hypergrowth rates. For example, only 32% were able to generate four consecutive quarters of 40% plus sales growth in our 2024 study. Our Hypergrowth Stock strategy incorporates this reality into stock selection through rebalancing the portfolio monthly while focusing on latest quarter sales results.
The Holy Grail in money management is based on earnings analysis but nowhere in hypergrowth discussions is the word ‘earnings’ mentioned. As noted, hypergrowth companies are typified by 40% plus sales growth. However, readers may be surprised to learn that many hypergrowth companies are losing money.
According to our work, upwards of 40% of some 30,000 stocks were losing money when entering their hypergrowth sales phase. We realize that avoiding money losing companies means missing out on many of the biggest winners in the stock market, so we shifted to using the sales metric in evaluating stocks six years ago.
Our studies indicate that a growing trend of Hypergrowth Stocks has persisted over the past 16 years. Out of a total stock universe of some 5400 stocks, only about 100 stocks come through our screens which we run every day. The annual average for any year since starting in 2010 has been quite broad but has averaged 129 per month since then.
It is notable that the number of Hypergrowth Stocks has been in a rising trend. During 2010-2019, the average number of Hypergrowth Stocks was 101, surpassed by an average of 176 during 2020-2025. We undertook an analysis of the returns compiled in these two periods and found that the period having the highest number of these stocks far outperformed the period having the lowest number. Average annual returns for each period were 33% versus 13%, respectively.
Most investors are unaware of the Hypergrowth Stock phenomenon. As such, we believe this gem of all asset classes is underrepresented in most portfolios. To learn more about Hypergrowth Stocks, readers can visit the website: InvestingInHypergrowth.com.
****
Robert Zuccaro, CFA is the Founder & Chief Investment Officer at Golden Eagle Strategies LLC – a Registered Investment Adviser. Robert has over four decades of experience in equity research and fund management, having led institutional portfolios through multiple market cycles. He’s been recognized by national financial publications for his work in systematic investing.
Email:info@goldeneaglestrategies.com / phone: (561) 510-6606