
As we reflect on 2025, it is hard to ignore the constant drumbeat of negative headlines: elevated geopolitical tensions, ongoing conflicts, trade frictions, and a broader shift toward de-globalisation. Yet, despite this backdrop of uncertainty, global equity markets once again delivered strong returns—another reminder that markets often advance not in the absence of risk, but in spite of it.
Market backdrop and performance
Table 1.
2025 market and fund returns.
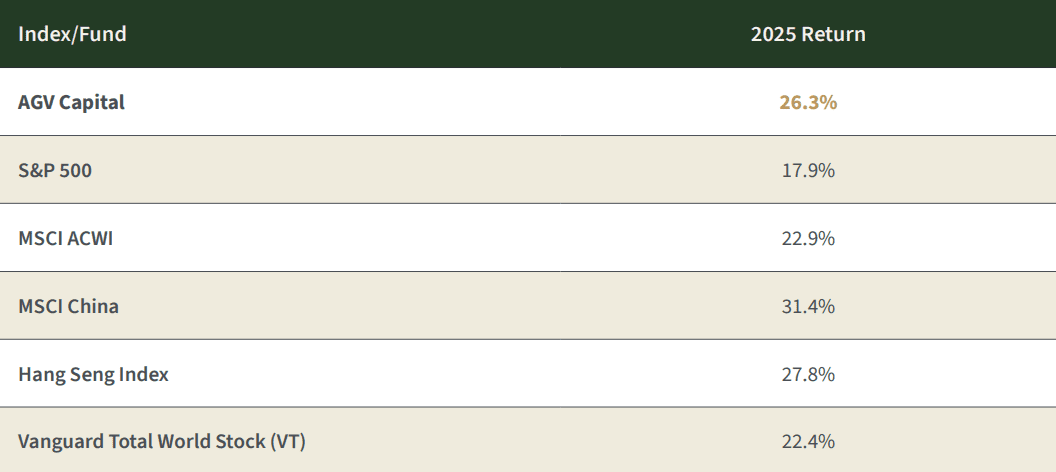
As the old Wall Street adage goes, the market climbs a wall of worry. In 2025, investors had no shortage of reasons to worry—wars, tariffs, interest-rate concerns, and an uncertain macro outlook—yet markets moved higher as businesses continued to grow revenues, earnings, and cash flows.
China, concentration, and where the real opportunity was
In last year’s annual letter, we laid out a clear, contrarian thesis. We tilted our allocation decisively toward China at a time when the consensus was widely viewed as unattractive by the market. In 2024, we placed approximately 86.0% of the portfolio in Chinese equities. That positioning proved well justified in 2025, as the MSCI China Index delivered a total return of 31.4%—its strongest year in nearly a decade—and significantly outperformed the S&P 500 total return of 17.9%.
Meanwhile, the S&P 500 itself became even more concentrated. Index levels of concentration reached extremes not seen since the 2000 internet bubble and the roaring 1920s, with the so-called “Magnificent Seven” accounting for roughly 34.0% of the index and contributing about 42.0% of total returns, driven largely by strong investor enthusiasm and momentum around AI-related themes. Excluding the Mag 7, the S&P 500 would have delivered a return closer to 10.0%, roughly in line with the S&P 500 Equal-Weighted Index at 11.0% and Vanguard’s Total US Stock Market Index at around 11.0%.
Figure 1.
Rising impact of the largest 7 U.S. stocks on index returns (1999–2025).
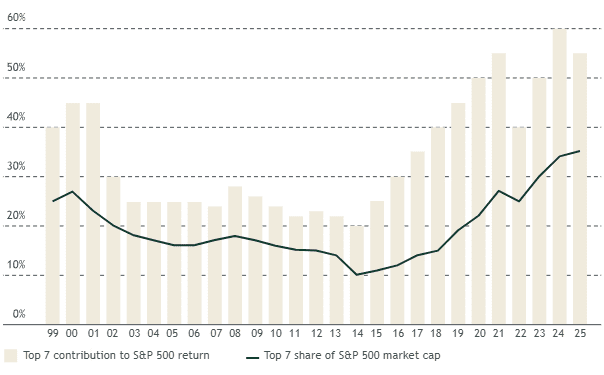
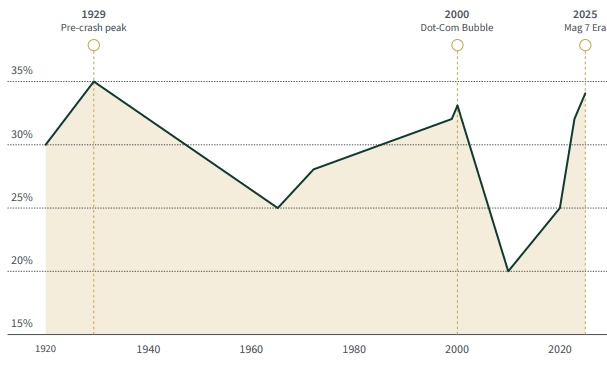
Figure 2.
fiop-7 stock concentration in U.S. market (1920–2025).
Current levels approach 1929 peak, surpassing dot-com era.
In a year when many active US-focused managers struggled to beat a Mag-7-driven benchmark, we delivered a gross return of about 26.3% while deliberately avoiding the US AI bubble and lofty valuations. We stayed anchored to our principles: buying high-quality companies at great valuations. As a result, we outperformed the S&P 500’s 17.9% and the MSCI ACWI Index’s 22.9%. This reinforces an important lesson: earning excellent returns is not about chasing whatever is fashionable; it is about owning great businesses at sensible prices.
China vs. the Magnificent Seven: who really delivered?
In last year’s letter, we compared a basket of leading Chinese large caps to the celebrated US Magnificent Seven and argued that price and sentiment were pointing in opposite directions. In 2025, that thesis played out in real time. On average, our China basket—Alibaba, BYD, Tencent, Baidu, PDD, and JD.com—returned roughly 30.0%, while the US Magnificent Seven as a group delivered about 22.0%. Few would have expected the supposedly “uninvestable” Chinese names to outpace their highly praised US counterparts, especially in a year when the Mag 7 enjoyed an AI-driven momentum tailwind and investors were convinced they would “change the world.”
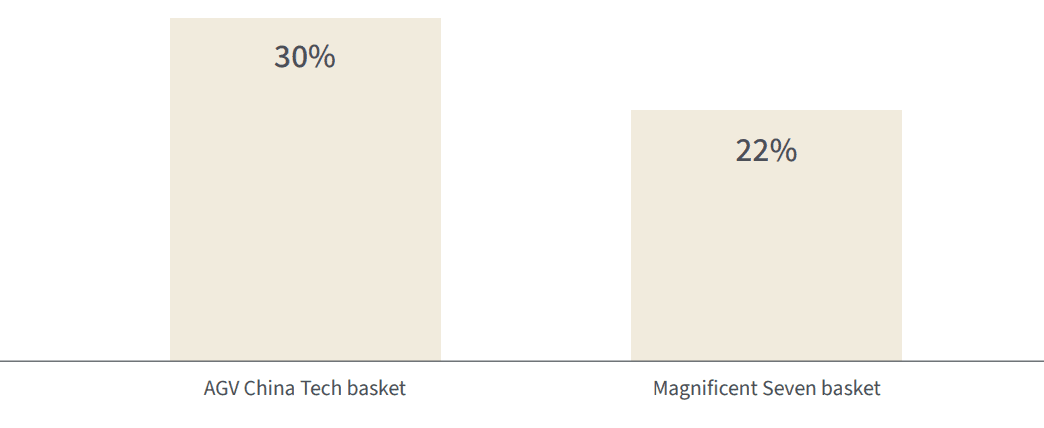
Figure 3.
2025 returns: AGV China tech basket vs. Magnificent Seven (total return, %).
AGV China Tech basket outperformed by 8 percentage points.
As the late Charlie Munger put it, the job is to fish where the fish are. For us, that means using our global mandate to go wherever the real opportunities lie—China, the US, or elsewhere—rather than hugging a single index simply because it feels familiar or popular with the crowd.
Looking through the lens of a holding company
We view the fund as a holding company. When we buy a stock, we think of it as owning a slice of a real business—its revenues, earnings, and cash flows—rather than just a ticker on a screen. To make this concrete, we aggregate the underlying fundamentals of every share we own and translate them into revenue, earnings, and free cash flow per fund unit. This approach allows us to judge our performance the way an owner would: through fundamental growth, profitability, portfolio quality, and valuation.
In 2025, our portfolio companies grew revenues by about 30.1% and earnings by 31.0% in US-dollar terms. In the local currencies in which they report, revenues grew 25.6% and earnings 26.6%, with the difference largely driven by dollar weakness and FX translation effects.
Table 2.
Revenue and earnings growth comparison (YoY).
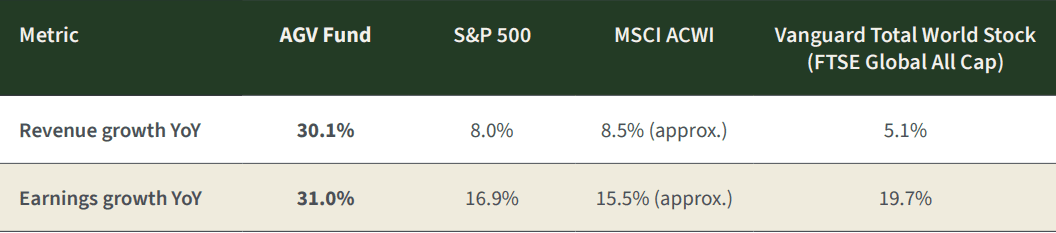
As you will see in the growth tables in the report, our companies delivered outstanding growth—substantially higher than the major indices we consider relevant benchmarks. Our roughly 26.3% gross fund performance for the year came almost entirely from this earnings growth. We did not benefit from multiple expansion; returns were driven by fundamentals, not rising valuations.
Valuation: strong returns without paying up
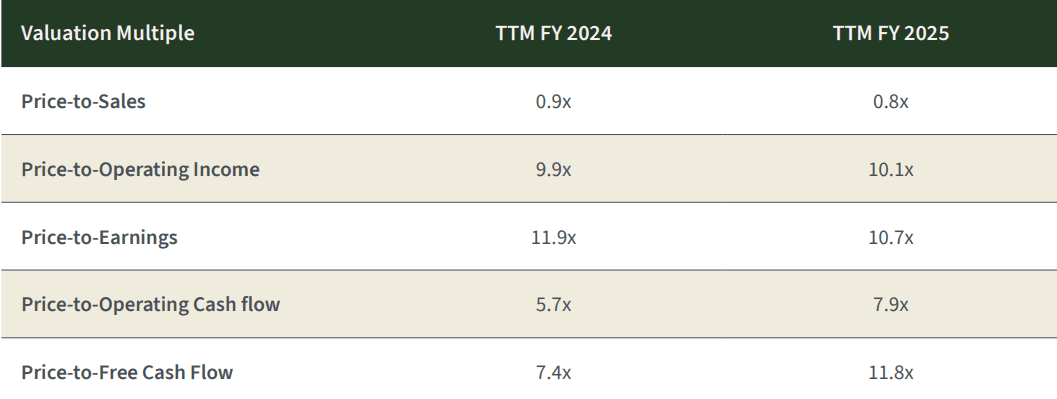
This lack of multiple expansion is visible when we compare our portfolio’s valuation today with last year’s. Despite the strong performance, our portfolio remains cheaper than, or broadly in line with, last year’s levels on most valuation metrics, and continues to trade at a meaningful discount based on our assessment of underlying fundamentals.
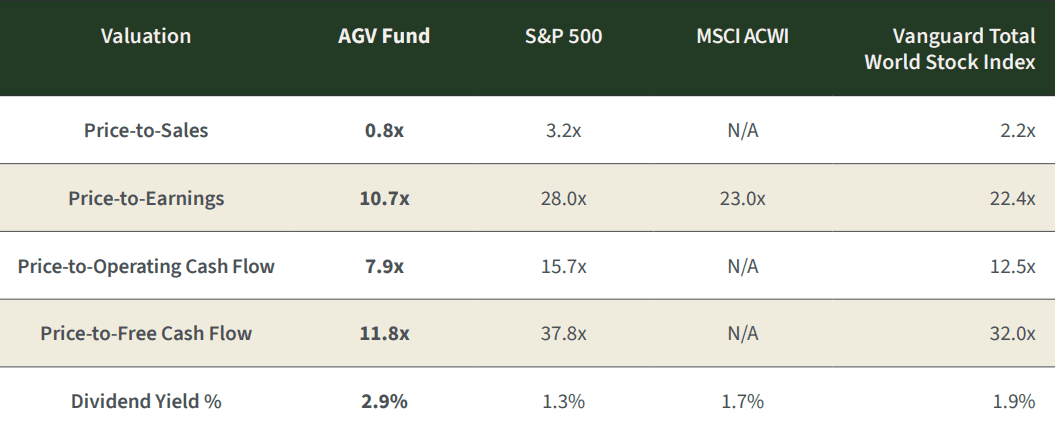
Table 3.
Valuation multiples.
When we set these valuations against those of major indices, the contrast becomes even clearer: our holdings trade at a substantial discount to global indices on earnings, sales, and free-cash-flow measures, while offering higher dividend yield and stronger underlying growth. That combination—better businesses at lower prices—is exactly what we look for.
Table 4.
Portfolio quality: returns on capital and profitability
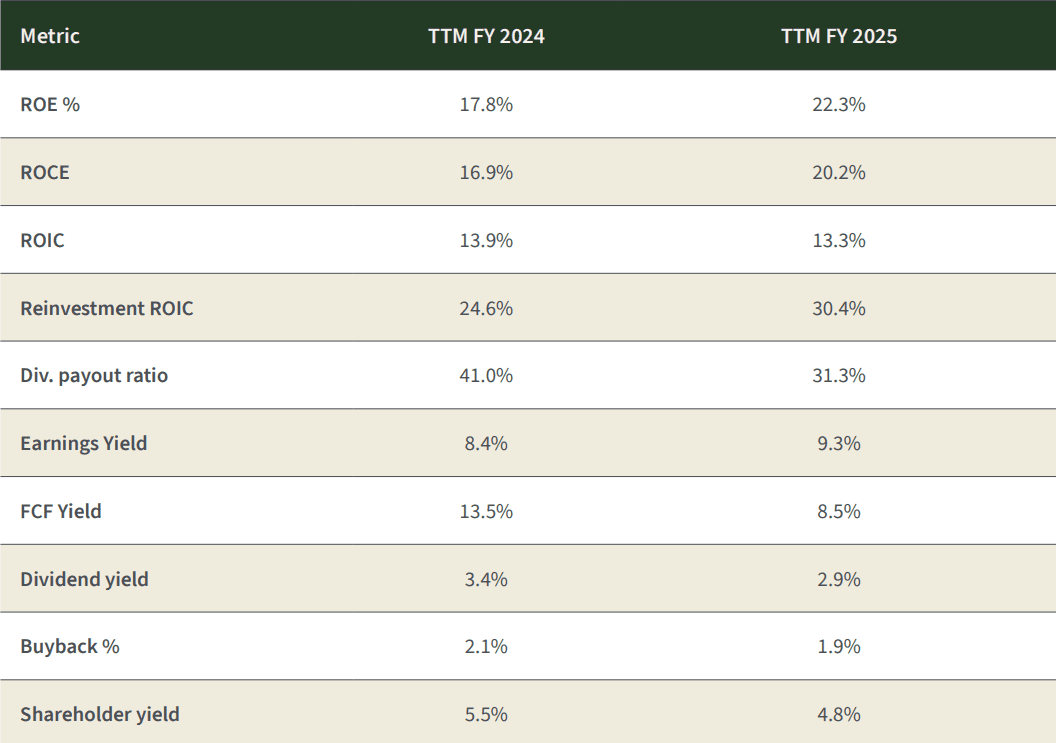
Valuation is only half the equation; quality matters just as much. In 2025 we improved the quality of the portfolio meaningfully. Our return on equity rose from around 17.8% to over 22.3%, and our return on capital employed increased from roughly 17.0% to just over 20.0%. Internal reinvestment ROIC also improved, showing that incremental capital is being deployed at very attractive rates of return.
Table 5.
Portfolio quality metrics.
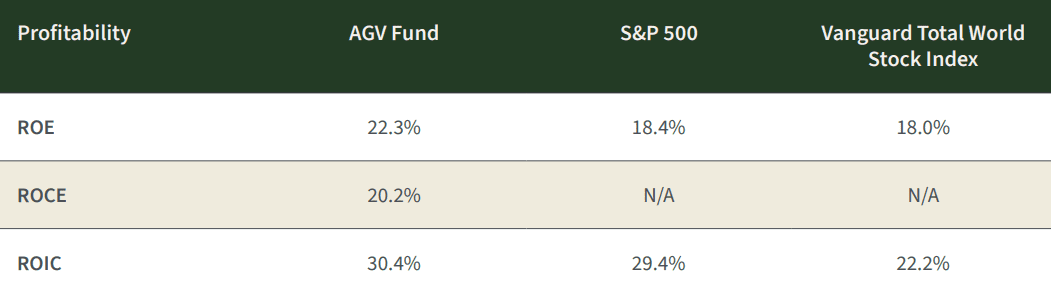
When we compare these metrics to the major indices, the gap is evident. Across Return on Equity, Return on Capital Employed, and Return on Invested Capital, our portfolio companies earn meaningfully higher returns on capital than the broad indices, highlighting both superior business quality and better capital allocation.
Table 6.
Profitability comparison.
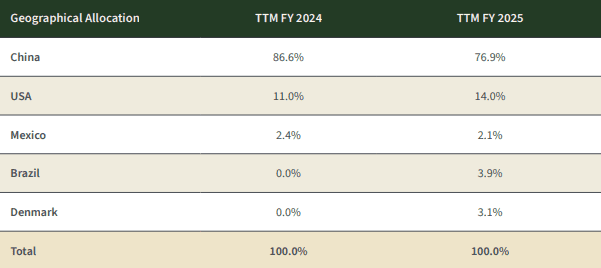
Geographic allocation: China still leads, diversification expanded
Our current geographic exposure compared with last year reflects both conviction and select diversification. We reduced our China exposure from the mid-80s to the high-70s and introduced two new regions—Denmark and Brazil—where we found exceptional businesses that meet our criteria. The US allocation also increased modestly as select opportunities emerged at reasonable valuations. We remain willing to go wherever the risk-reward profile is most attractive, rather than sticking to any home-market bias. The table & chart below summarizes our geographic allocation at year-end.
Figure 4.
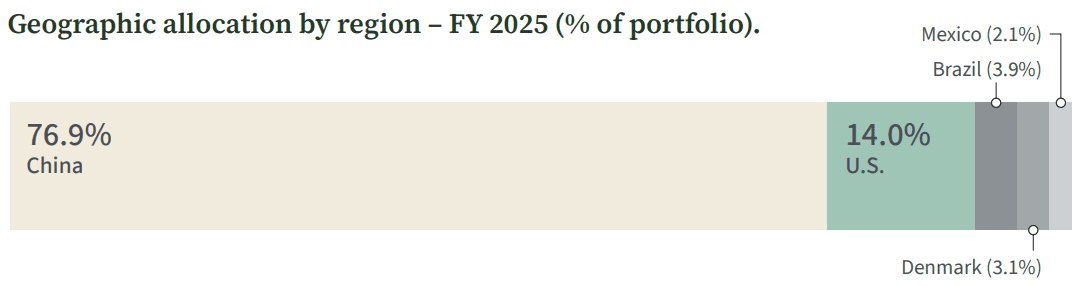
Table 7
Geographic allocation
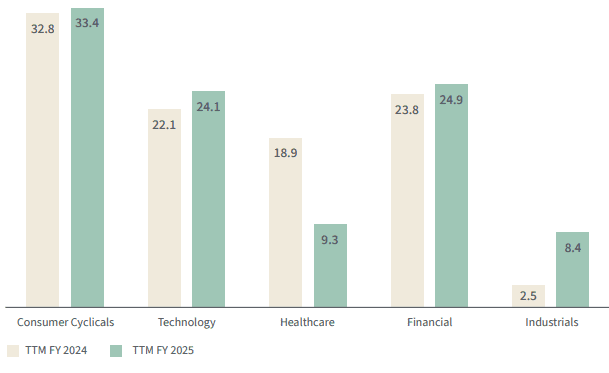
In addition to geography, we also manage diversification by business model and sector. The chart below shows our sector allocation as of year-end and comparison of last year, highlighting where we are finding the most compelling opportunities today.
Figure 5.
Sector allocation – year-on-year comparison (% of portfolio).
TTM = trailing twelve months
Putting it all together
We approach public markets with the mindset of business owners. Investing, to us, is akin to owning a family business: you focus on the long term, the durability of the model, the integrity and alignment of management, and the price you are paying relative to intrinsic value.
Our strategy is simple but demanding in practice:
- Own high–quality companies with durable competitive advantages.
- Partner with management teams whose incentives are aligned with shareholders.
- Pay prices that build in a margin of safety.
- Look globally, not locally, for the best mix of quality and value.
In 2025, our companies grew earnings by more than 30.0%, trade at valuations that remain well below global market averages, and exhibit higher returns on capital than the indices. This combination drove approximately 26.3% growth in the fund, allowing us to outperform the benchmarks while still leaving what we estimate to be roughly 30% undervaluation in the portfolio. If valuation gaps were to narrow and our holdings were to move closer to assessed fair value, this would imply meaningful upside potential, before considering any additional fundamental growth.
On top of this, our portfolio offers an estimated total shareholder yield of about 4.8%, combining a 2.9% dividend yield with 1.9% buyback yield. Even without assuming incremental growth, a convergence toward fair value would, in such a scenario, represent a material contributor to forward returns over time.
We are very optimistic about our holdings. We believe the companies we own are high quality, attractively valued, and well diversified by business model and geography. We also believe deeply in alignment: we invest alongside you in the fund, and I have personally increased my investment, reflecting my conviction in the opportunity ahead.
We hope this report gives you the clarity we would want if the roles were reversed and we were in your seat as shareholders. As always, thank you for your trust.
Kind Regards,
Khalid Saud Alaamry